USA & Tokyo Land Efficiency Model – Phase I

US & Tokyo Proportion Efficiency Map 1:200mi scale.

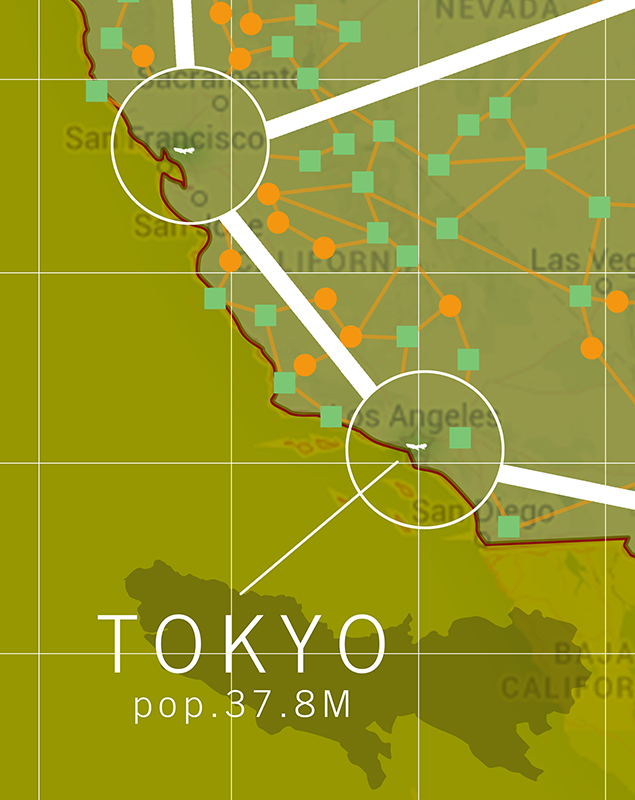
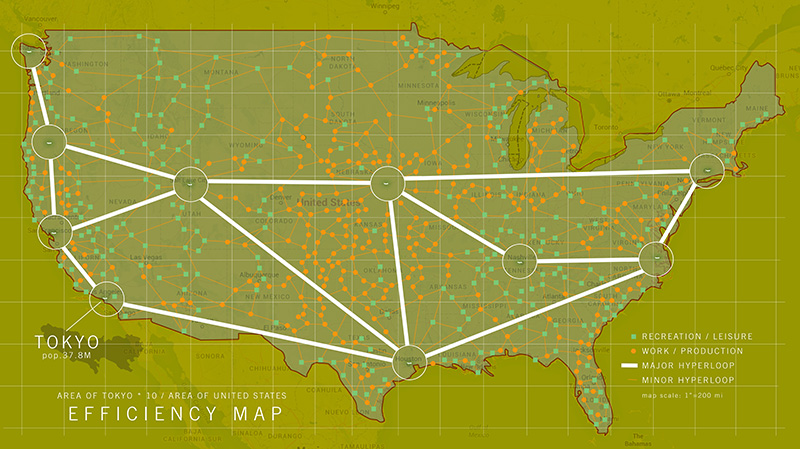
Thinking about the density of Tokyo and what it would be like to reduce our overall land footprint in the the United States to a microscopic level. I chose 10 locations to more than equal our population with a 25 year estimated advance in growth.

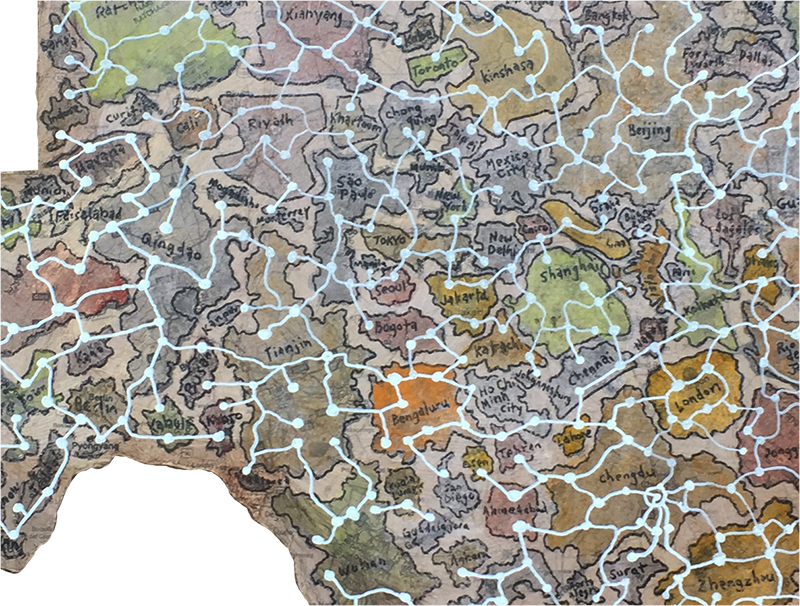
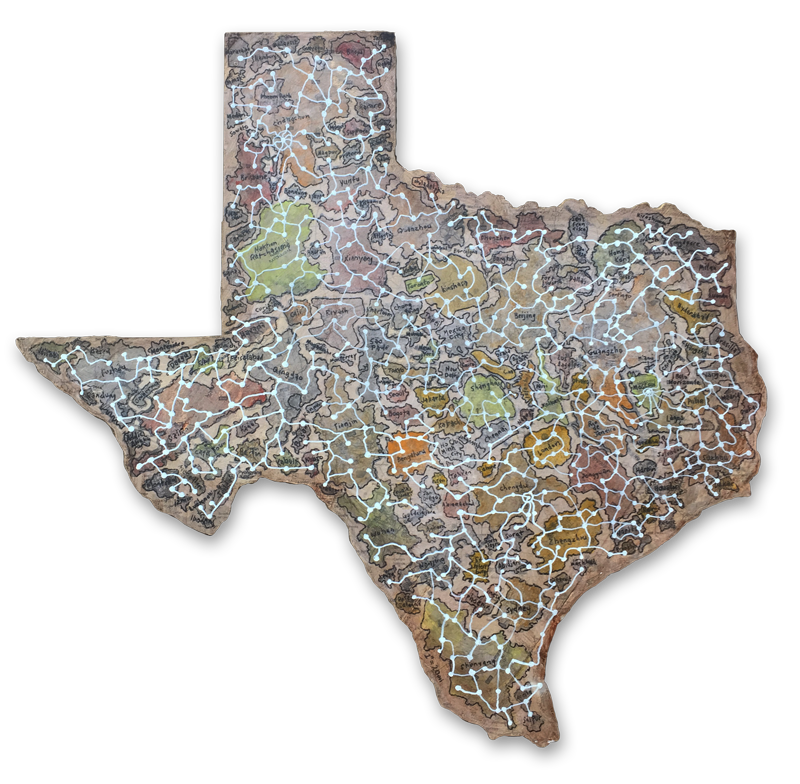
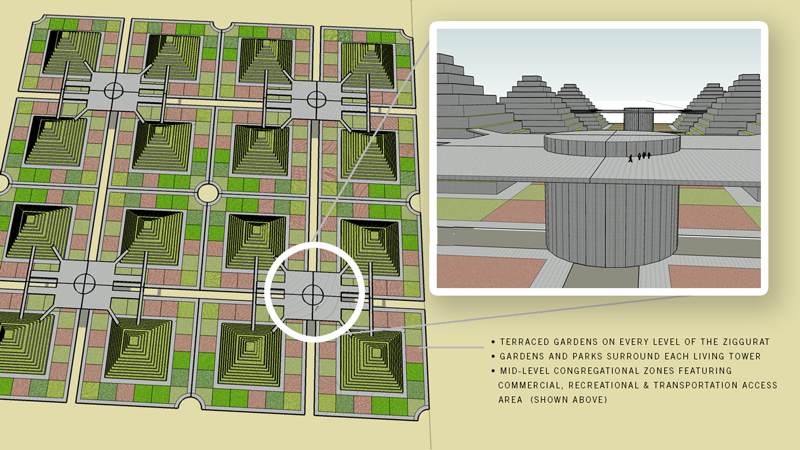
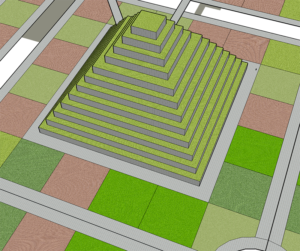
All living areas, cities that already have a dense population that can be migrated into the most efficient living centers – ziggurats that employ gardens and parks in proportion to each tower. With commercial areas for meeting and transportation centers to collect people at HyperLoop + This one too, hubs to easily get to specific work and recreational zones located around the U.S.

We currently have developed less than 5% of our land, but with focused density we could cut this by a factor of 100. Then use 
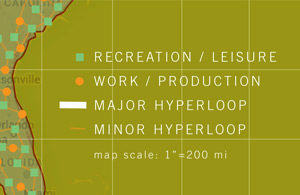
more open space for recreation and leisure. Also, by focusing our

agricultural and manufacturing to more efficient locations and geographic relationships we would gain a very powerful use of land.

We can start to be more efficient with how we handle our water, energy needs, food, living environment, daily regimen of exercise, human interaction and social connectedness.

ziggurat city plan based on .5 mile grid.

Other Research:

Live in a skyscraper:
Housing Projects
1 square mile project – utopian environment possible?
Water plan
Water / sewer potential
Food potential
Food handling, containers reuse, recycle:
Power potential
Travel
Clothing / Practical yet room for personal expression: Bamboo / Cotton
Outdoor Health, Recreation & Activities: see map
Vacations: see map
Arts:
Entertainment:
Employment:
Manufacturing: see map
Building Materials: see map
Spare Parts & Repairs: see map
Cemeteries:
Faiths:

Texas-World

texas-world-map-800
“Texas-World“, 33.5 x 32 in., scale: 1″=20miles, plywood map of the world’s 150 largest cities mapped into the geographical space of Texas, USA. J. Del Nero, 2016

TEXASWORLD Plan
Acres in Texas: 171,904,640
World Population: 6,602,224,175
= 38.5 people per acre. Density Goal: 10 dwellings/acres = 3.8 people per dwelling.

If the world was turned into a Monopoly® Game. How long would it take to become unbalanced again? Can we make everything even? Is equality a possibility? Let’s give everyone the same access to food, shelter, etc., what would happen?
I mapped the 150 most populated world cities into the map of texas at 1″ = 20 miles. I found that so many cities have such a small footprint, while the largest cities in China occupy such large swatches of land it overwhelmed some of the space in the map. It was quite a contrast to see in front of me.
texas-world-map-detail
The exercise of connecting the cities with the white constellation reminds me of an internet that doesn’t have to follow any particular geographical order, but can jump randomly in any direction.

The idea of having the iconic shape of Texas as the first thing you see give an impression of one type of mindset. In many ways the shape of Texas is as recognizable as the U.S. map. Texas also is an strange representation of a “typical American” so it seems appropriate to use this shape as a generalization of our society.

Also, Texas having flown under six different country flags also seems to be a kind of reminder of the history of the state.